Intermodal freight operator
We publish the transit time. Then we hit it.
Twelve terminals, twenty physical links, one timetable. Pick an origin and a destination below and the routing engine will tell you exactly how long the box is on our network — and how much of that it spends standing still.
Next departures
| Dep | Service | Arrives | Status |
|---|---|---|---|
| 06:45 |
LB-C4
ASH → DUN |
Thu 01:47 | Held: path |
| 00:00 |
LB-C1
ASH → MER |
Wed 08:29 | Loading |
| 12:15 |
LB-C7
CAW → THV |
Thu 07:26 | Held: path |
| 06:30 |
LB-C9
RAV → BEX |
Wed 13:08 | Held: path |
| 09:15 |
LB-C12
HAL → ASH |
Wed 21:52 | On time |
| 06:30 |
LB-C15
FEN → KEL |
Thu 01:48 | Held: path |
Pick two terminals. The engine searches the network for the fastest path, not the shortest one — and on a quarter of our lanes those are different routes, because a longer run on a single mode beats a shorter one that needs an extra lift.
Select an origin and a destination.
—— rail – – road · · · short-sea click a terminal to route to it
Every service below runs to a published path whether it is full or not. That is the whole product: a slot you can plan a factory around.
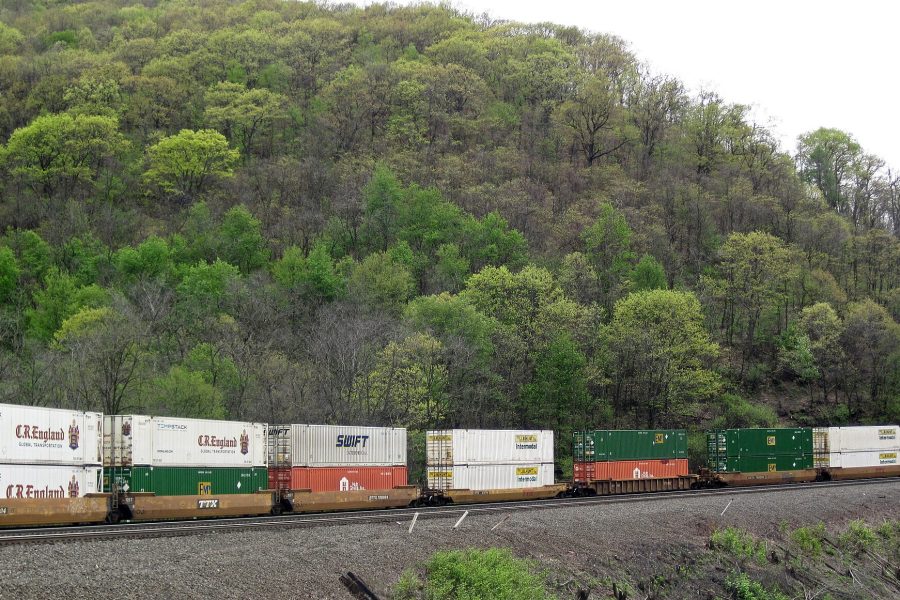 LB-C4
Corridor 4 — the Ashport landbridge
Coast to coast without touching the sea. The service the company is named after: a box discharged at Ashport is on the quay at…
LB-C4
Corridor 4 — the Ashport landbridge
Coast to coast without touching the sea. The service the company is named after: a box discharged at Ashport is on the quay at…
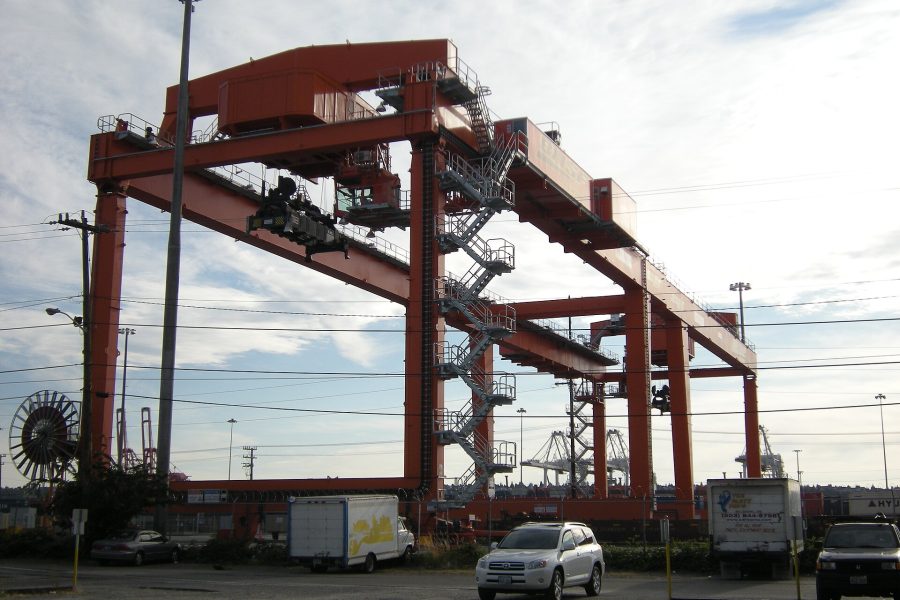 LB-C1
Corridor 1 — Ashport to Merrow Junction
The shortest and busiest thing we run: a 177 km straight line from the west-coast deep-sea berths to the middle of the network, four…
LB-C1
Corridor 1 — Ashport to Merrow Junction
The shortest and busiest thing we run: a 177 km straight line from the west-coast deep-sea berths to the middle of the network, four…
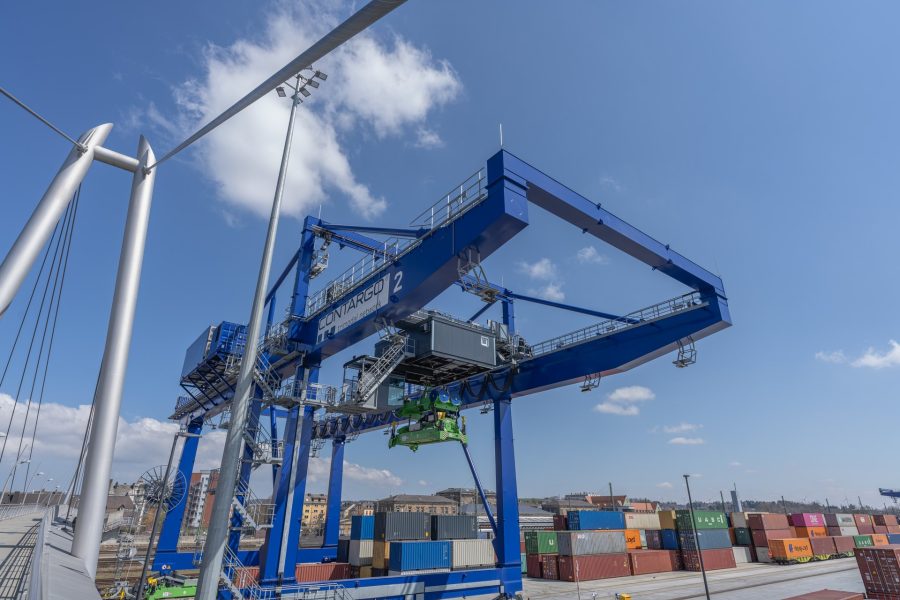 LB-C7
Corridor 7 — Cawdor Point to Thorne Vale
South-east short-sea arrivals to the northern interchange. The longest single-mode run we operate, and the clearest example of why the fastest route is not…
LB-C7
Corridor 7 — Cawdor Point to Thorne Vale
South-east short-sea arrivals to the northern interchange. The longest single-mode run we operate, and the clearest example of why the fastest route is not…
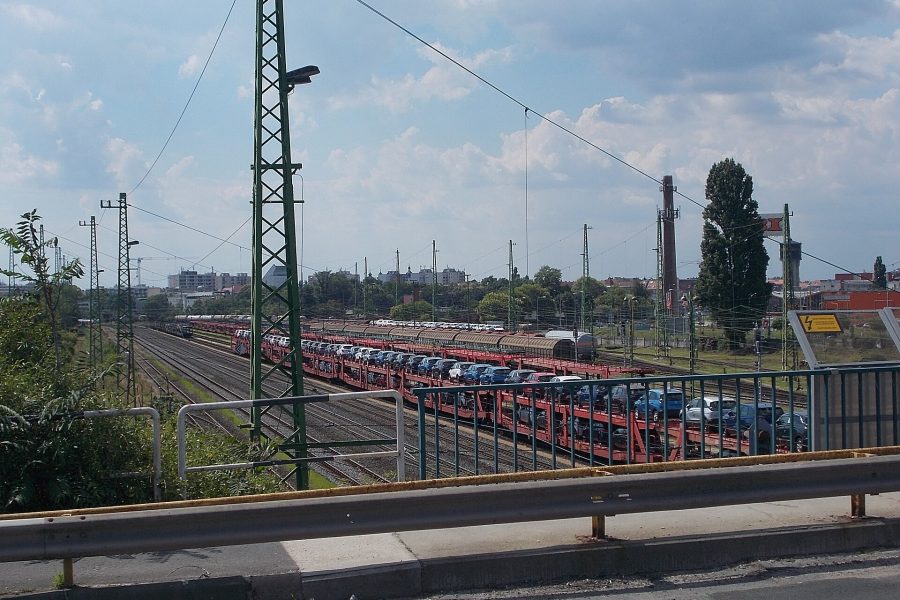 LB-C9
Corridor 9 — the Ravensworth automotive shuttle
A short, dense, dedicated shuttle for a single sector. The highest on-time performance on the network, and the one lane where five minutes actually…
LB-C9
Corridor 9 — the Ravensworth automotive shuttle
A short, dense, dedicated shuttle for a single sector. The highest on-time performance on the network, and the one lane where five minutes actually…
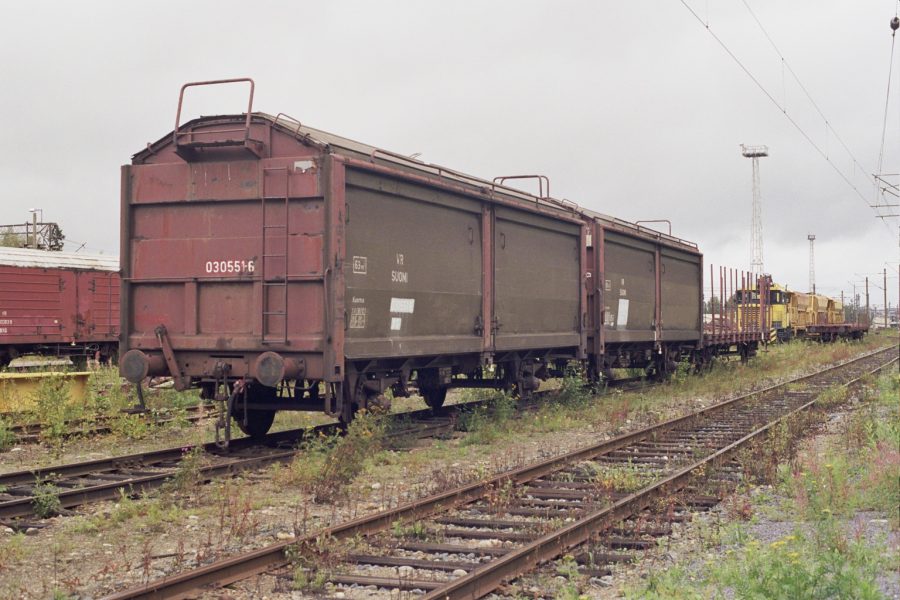 LB-C12
Corridor 12 — the Halgate harvest flow
The only seasonal service on the network. Halgate moves more than three times as much freight in October as it does in March, and…
LB-C12
Corridor 12 — the Halgate harvest flow
The only seasonal service on the network. Halgate moves more than three times as much freight in October as it does in March, and…
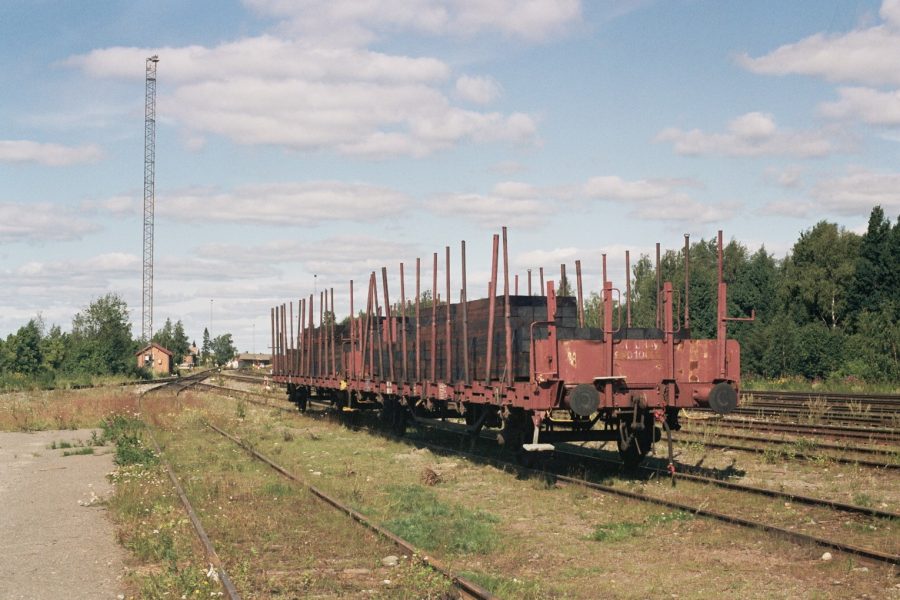 LB-C15
Corridor 15 — Fenwick Yard to Kelvedon Gateway
North to east, the long diagonal. Five legs, three of them through Merrow, and a third of the clock spent standing still.
LB-C15
Corridor 15 — Fenwick Yard to Kelvedon Gateway
North to east, the long diagonal. Five legs, three of them through Merrow, and a third of the clock spent standing still.
Freight is priced against whichever limit binds first — the cube or the axle. Put your handling units in and the planner will stow them for real, then tell you which one you hit.
This browser has no WebGL2, so the stow is not drawn. The figures below are unaffected — they come from the packer, not the picture.
Drag to orbit. Every box shown sits where the packer put it.
| Code | Terminal | Type | Gate | Lifting | Links |
|---|---|---|---|---|---|
| ASH | Ashport Deepwater | Seaport | 24/7 | Two ship-to-shore cranes, four rail-mounted gantries | 4 |
| DUN | Dunmore Quay | Seaport | 24/7 | One ship-to-shore crane, two rail-mounted gantries | 3 |
| CAW | Cawdor Point | Seaport | 05:00-23:00 | One ship-to-shore crane, two reach stackers | 3 |
| MER | Merrow Junction | Hub | 24/7 | Six rail-mounted gantries over four 775 m sidings | 5 |
| KEL | Kelvedon Gateway | Inland | 06:00-22:00 | Three rail-mounted gantries, two reach stackers | 4 |
| THV | Thorne Vale | Inland | 24/7 | Four rail-mounted gantries | 4 |
| SAL | Saltrigg | Inland | 06:00-20:00 | Two reach stackers | 3 |
| HAL | Halgate | Inland | 06:00-22:00 | Two rail-mounted gantries | 3 |
| BEX | Bexley Cross | Inland | 24/7 | Three rail-mounted gantries, one reach stacker | 4 |
| OND | Ondermere | Inland | 06:00-22:00 | Two rail-mounted gantries | 3 |
| FEN | Fenwick Yard | Inland | 24/7 | Three rail-mounted gantries | 2 |
| RAV | Ravensworth | Inland | 06:00-20:00 | Two reach stackers | 2 |
The moving lines behind this page are not decoration. They are a running Nagel–Schreckenberg cellular automaton — the standard minimal model of traffic — with one corridor per row and a different vehicle density in each.
Watch a busy row for a few seconds and you will see a bright cluster of stopped vehicles drift backwards against the direction of travel. Nothing crashes and nothing brakes on purpose; the only ingredient is a 30% chance that any vehicle dawdles by one cell on any step. That single random slowdown is enough to make a jam out of nothing, and it is the reason a corridor at 90% utilisation is not 90% as good as one at 45%.
It is also why we sell slots on a timetable instead of selling every path we own. The plot beside this text is measured out of the live simulation, not drawn: each dot is one corridor's actual density against its actual throughput.
Sampling the simulation…
 A grain marketing cooperative
Four months of the year, this terminal does three times the work
A seasonal flow does not fit an annual timetable. We stopped trying to make it.
A grain marketing cooperative
Four months of the year, this terminal does three times the work
A seasonal flow does not fit an annual timetable. We stopped trying to make it.
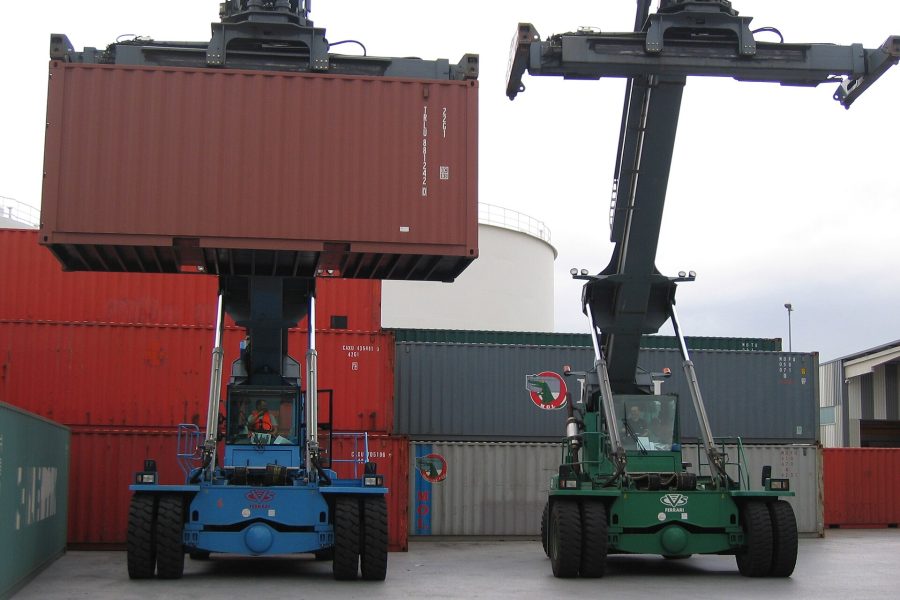 A vehicle assembly plant
A two-hour delivery window, three times a day, for four years
Line-side delivery is the hardest promise in freight, because the cost of being wrong is not a late box — it is a stopped…
A vehicle assembly plant
A two-hour delivery window, three times a day, for four years
Line-side delivery is the hardest promise in freight, because the cost of being wrong is not a late box — it is a stopped…
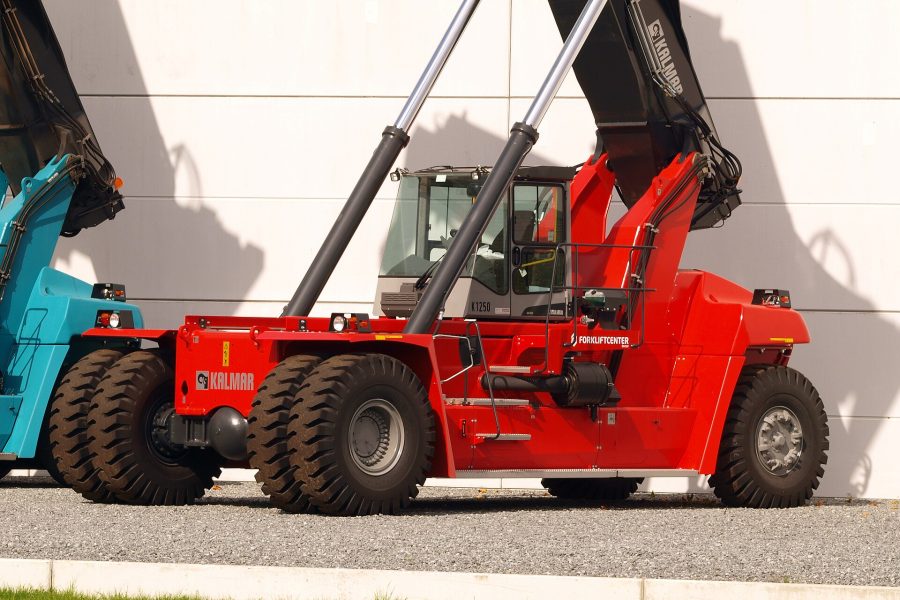 A grid equipment manufacturer
One 41-tonne transformer, and the only pad that would take it
Most freight problems are ordinary. This one was a single indivisible object heavier than any other terminal on the network could lift.
A grid equipment manufacturer
One 41-tonne transformer, and the only pad that would take it
Most freight problems are ordinary. This one was a single indivisible object heavier than any other terminal on the network could lift.